Data Acquisition:
The DGBOX is a highly cost effective solution for data acquisition/logging from field devices on protocols (communication interfaces) like:
BACnet IP
|
BACnet MSTP
|
Modbus TCP
|
Modbus RTU
|
OPC DA
|
SNMP
|
EnOcean
|
Insteon
|
Philips Hue
|
Mamac Maverick
|
MBus
|
SQL
|
HTTP Retriever
|
HTTP Receiver
|
ASCII File Reader
|
ASCII Serial
|
Scripting
|
POP3 Email
|
Pachube
|
Virtual Data Source
|
VMStat Data Source
|
Persistent TCP
|
KNX
|
|
|
Downloads:
- Datasheet
- Information Brochure
- Set up a live demo appointment
- Question/Purchase
Data Storage:
The acquired data can be stored on the database on board and external flash memory (Micro SD Cards). This data can be used later for historical trends or serve as input to analytics.
The data storage in DGBox is handled by an Embedded Time Series Database which is specifically designed and optimized for lightning fast read and write speeds of time series data. This specialized database allows for the ability to write over a thousand points per second and be able to retrieve thousands of points in nano-seconds. The amount of data stored on the DGBox is expandable through the external SD card or eSATA port so you can be sure that you will never run out of space for storing your trend data.
Visualization:
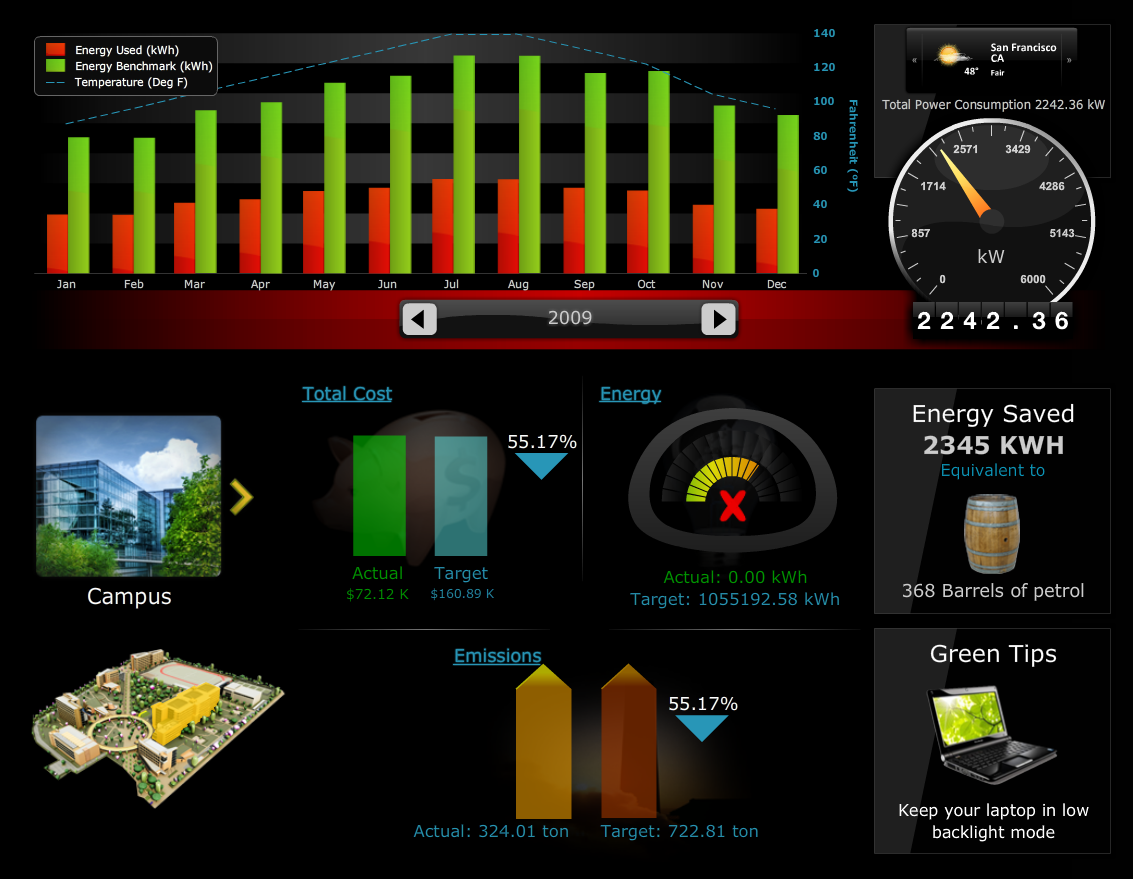
DGBox offers the best in class visualization dashboards using the award winning graphic tool DGLux. The users can choose from the available library of templates or create custom templates depending on specific requirements. Pre-built templates for devices like power meters, thermostats, and other field equipment help accelerate solution deployment. All templates can run on any desktop or mobile platform.
Sample dashboards

Specifications:
HARDWARE BOX
Marvel® Sheeva™ Core Embedded CPU @1.2 GHz
SDRAM: 512 MB 16 bit DDR2 @800 MHz
Flash Memory
4 GB internal mirco-SD
Expandable external SD
Power
Input: 100-240VAC/50-60Hz 19W
DC Consumption: 5V/3.0A
High efficiency detachable AC-DC PSU
[Image DGBOx]
High Speed I/O & Peripherals
2 x Gigabit Ethernet 10/100/1000 Mbps
2 x USB 2.0 ports
1 x eSATA 2.0 port - 3 Gbps STAII
WiFi: 802.11 b/g/n
Bluetooth: Bluetooth 2.1 + EDR
Dimensions
H: 108mm W: 58mm D: 24mm
Applications:
DGBox as Modbus RTU Data Client/data logger: Read data from your Modbus RTU field devices (RS-485 and RS-232) such as energy meters. The data can be used for:
- Live data dashboards: users/supervisors can get real time information on the status, alarms and field conditions.
- Historical trends and analysis using data stored.
- sent to remote application over HTTP
DGBox as Modbus TCP Data Client/data logger: Read data from your Modbus TCP field devices such as air flow meters. The data can be used for:
- Live data dashboards: users/supervisors can get real time information on the status, alarms and field conditions.
- Historical trends and analysis using data stored.
- sent to remote application over HTTP
DGBox as BACnet MSTP Data Client/data logger: Read data from your BACnet MSTP field devices such as HVAC controllers, actuators etc. The data can be used for:
- Live data dashboards: users/supervisors can get real time information on the status, alarms and field conditions.
- Historical trends and analysis using data stored.
- sent to remote application over HTTP
DGBox as BACnet IP Data Client/data logger: Read data from your BACnet IP field devices such as thermostats. The data can be used for:
- Live data dashboards: users/supervisors can get real time information on the status, alarms and field conditions.
- Historical trends and analysis using data stored.
- sent to remote application over HTTP
DGBox as MBus Data Client/data logger: Read data from your MBus field devices such as BTU Meters. The data can be used for:
- Live data dashboards: users/supervisors can get real time information on the status, alarms and field conditions.
- Historical trends and analysis using data stored.
- sent to remote application over HTTP
DGBox as SNMP Data Client/data logger:Read data from your SNMP field devices such as UPS, PDUs etc. The data can be used for:
- Live data dashboards: users/supervisors can get real time information on the status, alarms and field conditions.
- Historical trends and analysis using data stored.
- sent to remote application over HTTP